

Executive Overview
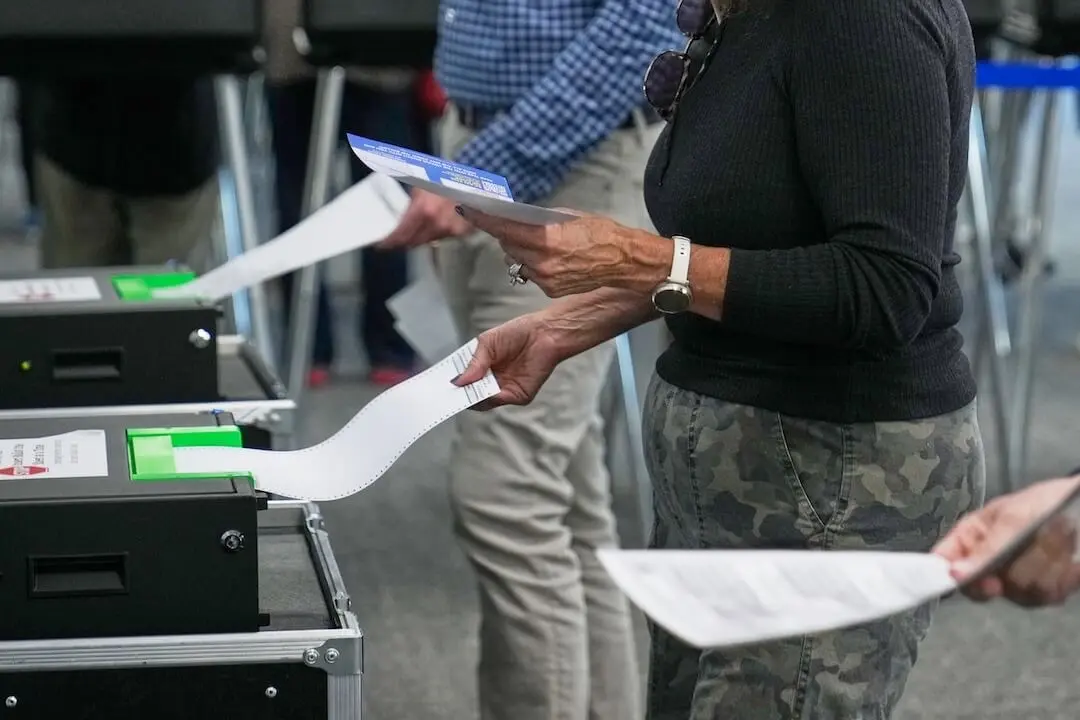
Understanding the modern American electorate has transitioned from a routine journalistic challenge into an existential crisis for the profession. In an era defined by profound political polarization, institutional distrust, and hyper-targeted digital messaging, the voting public appears increasingly fractured. Voters casting ballots at the same neighborhood polling places often inhabit entirely different informational realities, shaped by curated news sources and algorithmic social media feeds. Yet, the tools available to journalists attempting to decode these shifting tides have remained stubbornly archaic.
For decades, the press has relied on a flawed binary of data: pre-election horse-race polls that capture ephemeral intentions without probing underlying motivations, and post-election returns that reveal who won and where, but offer zero insight into why. While academic surveys eventually unpack the sociological and psychological drivers of a vote, they typically materialize months after an election, when the political window for accountability has slammed shut.
This analytical vacuum reached a watershed moment during the 2016 presidential election. For millions of citizens—and the journalists tasked with informing them—the outcome felt surreal, largely because the prevailing data infrastructure failed to detect the deep economic malaise, cultural alienation, and anti-establishment fervor coursing through working-class communities. When the press cannot accurately diagnose the motivations behind an election outcome, the consequences are severe. Victors are left unchecked to claim sweeping, unearned mandates for any policy agenda they choose, while the losing half of the country is free to conclude that their compatriots have simply lost their minds.
To bridge this critical gap, a revolutionary initiative is transforming how we dissect democratic participation. Developed by NORC at the University of Chicago, a nonpartisan and objective research organization, the Civic Health & Elections Project (CHEP) is rewriting the rules of political journalism. By surveying more than 85,000 registered voters across all 50 states in the week leading up to Election Day—and releasing that granular, deeply contextualized dataset within hours of the polls closing—CHEP promises to move the press beyond monolithic narratives of "red states" and "blue states." This in-depth report explores the anatomy of political miscalculation, the mechanics of this groundbreaking data tool, and what it demands of a modern, forward-looking journalistic corps.
Detailed Chronology: From the 2016 Blind Spot to the Present Data Revolution
To understand the urgent necessity of advanced electoral data, one must examine the historical missteps that exposed the fragility of traditional election reporting. The path to the current paradigm shift is marked by systemic failures in foresight, methodology, and narrative construction.
The 2016 Shockwave
The historical turning point for modern political journalism occurred on November 8, 2016. In the wake of Donald Trump’s victory over Hillary Clinton, newsrooms across the globe experienced an acute reckoning. The shock was not merely partisan; it was professional. Virtually every major poll, statistical model, and journalistic narrative had pointed toward a different outcome.
In hindsight, the failure was structural. The press had relied heavily on top-line horse-race polling that measured national or statewide aggregate preferences while ignoring the qualitative textures of the electorate. Journalists spent precious time chasing daily campaign gaffes rather than listening to the underlying signals of public discontent. Specifically, the deep-seated malaise, economic anxiety, and profound distrust of coastal institutions among working-class voters in the Rust Belt went largely undocumented or were severely underestimated.
When the results rolled in, the inadequacy of the industry’s toolset became glaringly obvious. Without a rich understanding of why those voters mobilized, the press struggled to provide coherent, nuanced explanations. Instead of fostering national comprehension, the coverage inadvertently deepened the cultural chasm, leaving urban and rural, liberal and conservative populations feeling entirely alienated from one another.
The Post-2016 Epiphany and Methodological Stalemate
In the years following 2016, newsrooms attempted to course-correct by hiring more data scientists, focusing on working-class demographics, and running endless focus groups. However, the fundamental structural impediment remained: the data timeline was completely out of sync with journalistic urgency.
- Pre-Election Polling: These metrics offer a real-time snapshot of voter intentions, but they are notoriously shallow. They tell a reporter who is ahead by two points, but they cannot explain whether that lead is built on enthusiastic policy support, reluctant lesser-of-two-evils calculus, or sheer partisan habit.
- Post-Election Returns: These provide absolute precision regarding geography and turnout, but they are emotionally and analytically mute. A 15-point victory in a rural Oklahoma district or an urban Vermont precinct tells a story of outcome, not motivation.
- Academic Post-Mortems: Rigorous, peer-reviewed surveys conducted by political scientists provide profound insights into behavioral drivers, but they typically publish their findings six to twelve months later. By then, legislative battles have been fought, mid-term cycles have begun, and the public square has moved on.
The Birth of the Civic Health & Elections Project
Recognizing that a democracy cannot function when its citizenry and press operate in an informational fog, researchers at NORC at the University of Chicago began conceptualizing a comprehensive infrastructure fix. The goal was to build a bridge across the chasm separating real-time election returns from deep sociological analysis.
The Civic Health & Elections Project was engineered to shatter historical sampling limitations. Rather than focusing exclusively on a handful of battleground states—Pennsylvania, Wisconsin, Georgia—CHEP designed a nationwide framework capable of capturing the granular sentiment of voters in every single state and territory. By deploying massive survey resources immediately before the close of polls and synchronizing data architecture for rapid public deployment, NORC created a mechanism designed to answer the ultimate journalistic question: Why did the electorate make this choice?
Supporting Context & Metrics: Breaking the Monolith of "Red" and "Blue" America
The standard journalistic shorthand of modern American politics relies on geographic stereotyping. States are routinely flattened into monolithic color blocks: safe blue bastions or impregnable red strongholds. This lazy taxonomy harms local reporting and distorts the national conversation.
The Fallacy of the 15-Point Victory
Consider a congressional district in a deep-red state like Oklahoma or a deep-blue state like Vermont that swings toward a party by 15 points. Under the traditional media regime, that outcome arrives with an implied, pre-packaged explanation. For the red district, the narrative defaults to cultural conservatism and religious zeal; for the blue district, it defaults to progressive ideology and secularism.
Most journalists and readers accept these superficial explanations because no alternative dataset exists to challenge them. Consequently, the local press in non-battleground states is often sidelined, treated by national outlets as irrelevant to the grand narrative of national power struggles.
The Civic Health & Elections Project dismantles this monolithic framework. By surveying a massive cohort of over 85,000 registered voters—ensuring a minimum floor of 750 respondents in every single state—CHEP provides local and regional reporters with the statistical power to look beneath the surface.
Traditional Media Model:
[Election Outcome (e.g., +15 Red)] ──> [Implied Monolithic Narrative] ──> [Superficial Reporting]

CHEP Data-Driven Model:
[Election Outcome (+15 Red)] ──> [CHEP Granular Dataset (85k+ Voters)] ──> [Subgroup & State-Specific Analysis] ──> [Nuanced Local Journalism]
Unlocking Subgroup Realities
With a robust sample size of at least 750 respondents per state, journalists are no longer forced to rely on statewide aggregates. They can slice and dice the data to answer highly specific questions:
- Do voters in a specific state who backed the winning gubernatorial candidate also believe the local economy is improving, or are they voting out of economic anxiety?
- Do they trust the public institutions tasked with implementing the winner’s proposed agenda?
- How do public expectations regarding health care access or immigration enforcement diverge between neighboring states with similar voting patterns?
- Within a supposedly safe state, how do suburban voters differ from their rural counterparts on critical ballot measures?
By offering interactive dashboards, mapping tools, and raw datasets that go public within hours of polls closing, CHEP transforms local reporters into investigative macro-analysts. They can compare their state’s electorate with demographically similar states, isolate anomalies, and accurately report on the nuanced bargains voters struck in the privacy of the ballot booth.
Official Statements and Research Methodology
The academic and operational rigor behind the Civic Health & Elections Project reflects NORC’s status as a premier, nonpartisan research institution. Leadership at NORC emphasizes that a vote is rarely a simple, unadulterated expression of personal opinion; rather, it is a complex, often begrudging choice weighed against imperfect alternatives.
The Philosophy of the Ballot
In public statements outlining the project’s core philosophy, NORC researchers argue that reducing a vote to a single cross-tabulation in a pre-election poll fundamentally disrespects the gravity of civic participation.
"A vote is not an opinion. It is a choice, often a complicated and begrudging one. The reasons behind it deserve more than a single crosstab. Doing better requires data that do not currently exist in usable form,"
project directors note. When voters step into a voting booth, they are balancing competing priorities—inflation versus reproductive rights, national security versus institutional trust, systemic reform versus political stability. Capturing this web of trade-offs requires an unprecedented volume of high-quality survey data deployed at scale.
Methodological Architecture
The operational mechanics of CHEP are designed for both speed and statistical integrity:
- Scale: A staggering sample size exceeding 85,000 registered voters surveyed nationwide during the critical final week of the campaign.
- Geographic Equity: A strict quota guaranteeing a minimum of 750 validated respondents per state, ensuring that small-population and non-battleground states receive the same analytical depth as traditional swing states.
- Speed to Public: Unlike academic datasets that take months to clean and publish, CHEP’s core dataset, interactive dashboards, and mapping tools are deployed to the public and newsrooms within hours of the polls closing (specifically timed for release at 12:01 AM Eastern time).
- Accessibility: The data architecture is deliberately designed to bypass the need for a dedicated statistician or an elite data desk in a newsroom. Through intuitive visual interfaces and available training tutorials, everyday reporters can extract compelling, localized stories immediately.
Future Outlook: Rebuilding National Comprehension Through Accountability
The release of real-time, granular electoral data represents more than a technological upgrade for newsrooms; it is a vital precondition for democratic health.
The Cost of Unchallenged Narratives
When an election concludes and no one can definitively prove why the public voted the way it did, a dangerous vacuum is created. Without empirical guardrails, political victors are emboldened to claim an absolute, universal mandate for any policy extreme they wish to pursue. Simultaneously, the losing half of the electorate retreats further into cynicism, concluding that their fellow citizens have abandoned reason.
This absence of shared factual grounding feeds the cycle of polarization. Journalism fails in its primary democratic duty when it merely records who won a contest without explaining the underlying social contract that produced the result.
A Challenge to the Journalistic Corps
The success of tools like the Civic Health & Elections Project depends ultimately on the intellectual curiosity and rigor of the journalists who use them. In a call to action for the reporting community, project organizers issue a straightforward challenge:
- Pre-Mortem Curiosity: Before the data drop at midnight on election night, every reporter should write down two fundamental questions about their state’s electorate that they have never been able to answer using traditional reporting tools.
- Intentional Inquiry: The journalists who extract the most value from CHEP will not be those who passively scroll through top-line numbers, but those who arrive at the dataset with precise, burning inquiries about their local communities.
- Sustained Engagement: Understanding the electorate cannot remain a frantic, five-day media sprint that abruptly terminates the moment the final race is called. True political journalism treats the election outcome not as an ending, but as a baseline—the foundational data point required to hold elected officials accountable to the actual desires of their constituents.
Conclusion
As the United States navigates an increasingly fraught political future, the path toward national self-comprehension begins with better listening tools. By merging sociological depth with lightning-fast delivery, projects like CHEP offer an antidote to media fatigue and partisan tribalism. When local reporters in every corner of the country can accurately explain the motivations, fears, and hopes of their local electorates, the nation slowly begins to make sense to itself again—one rigorously reported story at a time.