

Executive Overview
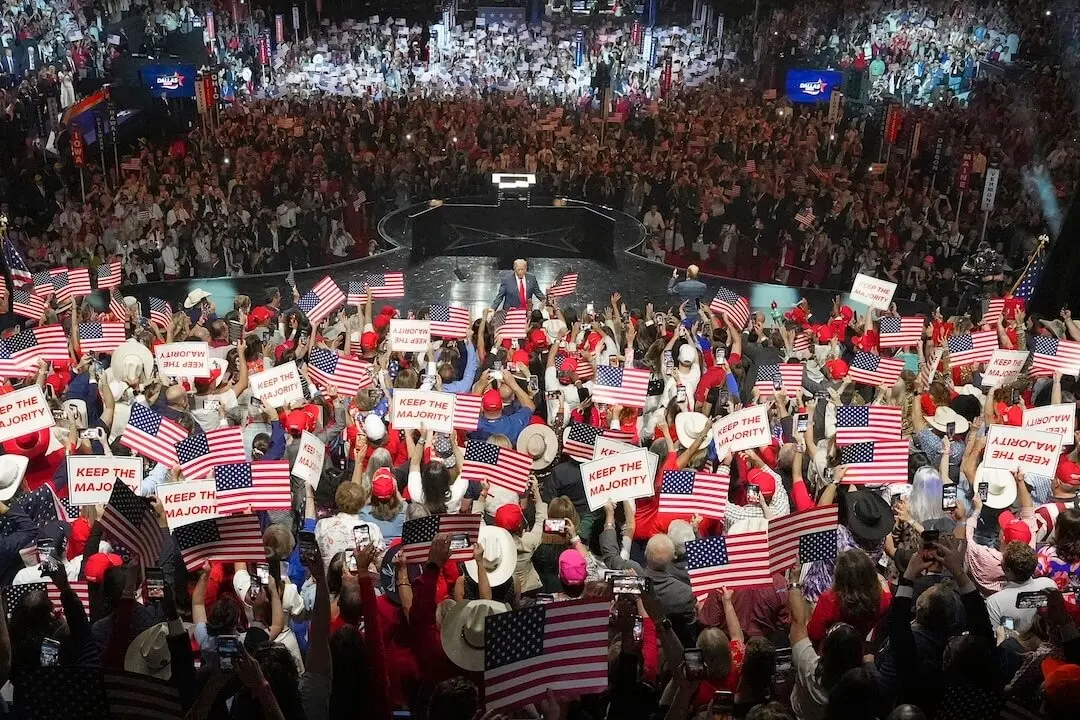
In the high-stakes theater of modern American politics, public perception is frequently treated as a malleable asset, shaped as much by assertion as by objective reality. This dynamic was on vivid display following the Republican Midterm Convention in Dallas, Texas. Following a nearly two-hour keynote address that dominated the event’s opening night, President Donald Trump took to Truth Social to declare the gathering an unprecedented multimedia triumph. According to the president, the convention was a "major, sold out hit" that generated viewership numbers so massive they managed to eclipse the cultural juggernaut of the National Football League (NFL).
"The overall numbers beat the NFL," Trump wrote, framing the political convention as a dominant force that successfully competed against professional football head-to-head.
However, an exhaustive analysis of industry-standard metrics, Nielsen television ratings, and expert commentary reveals a stark divergence between the White House’s triumphant narrative and verifiable data. Far from outperforming professional football, the Republican Midterm Convention was decisively outperformed by the NFL on television screens nationwide. While the Trump administration and its defenders pivoted to alternative digital metrics—such as social media "impressions" on platforms like TikTok—media and data analytics experts emphasize that comparing raw impressions to traditional broadcast viewership is a category error.
This investigative report examines the timeline of the claims, analyzes the precise television ratings for both the political convention and the competing NFL matchups, explores the fundamental mechanics of social media analytics, and places the administration’s claims within a historical pattern of crowd and viewership inflation.
Detailed Chronology
The clash between political pageantry and sports entertainment unfolded over a tightly packed 48-hour window in September, setting off a rapid chain of events involving real-time boasting, digital defense mechanisms, and delayed statistical reality checks.
September 10: The Dallas Kickoff and Truth Social Declaration
The Republican Midterm Convention commenced in Dallas, drawing conservative activists, media figures, and party leadership to the Lone Star State. President Trump delivered a sprawling, nearly two-hour address during the event’s opening session. Coincidentally—or perhaps competitively—the evening directly coincided with the high-profile NFL season opener.
Hours after stepping off the stage, Trump published a jubilant post on Truth Social. He asserted that the convention was streaming "all over the place" and boasted of "really big numbers, despite going up against the NFL." Without citing specific metrics, the president maintained that the overarching reach of the convention had surpassed that of professional football.
September 11: The Second Night and Vice Presidential Address
The convention’s second night featured Vice President JD Vance as the keynote speaker, accompanied by a shorter supplementary address from President Trump. This programming ran concurrently with the NFL’s second marquee matchup of the young season—an international regular-season game played in Melbourne, Australia, between the San Francisco 49ers and the Los Angeles Rams.
Mid-September: The Nielsen Data Release
As is standard industry practice, definitive broadcast metrics require days to process and aggregate. When Nielsen released its industry-standard television ratings shortly after the convention concluded, the hard data painted a picture vastly different from the one sketched out on social media. Media analysts immediately began mapping the audience share, revealing that millions more Americans tuned in to watch football than tuned in to watch the political speeches.
The Administration’s Pivot to Digital Metrics
Facing mounting media scrutiny over the television data, representatives for the administration and prominent political allies shifted their defensive perimeter. Rather than defending the Nielsen broadcast numbers, they pivoted entirely to digital reach, pointing toward cumulative social media impressions generated across alternative streaming platforms like TikTok and X (formerly Twitter). This pivot highlighted a growing divide in modern media measurement: the chasm between passive digital algorithmic exposure and active, deliberate television viewing.
Supporting Context & Metrics: TV Ratings vs. Digital Reach
To understand the scope of the discrepancy between the president’s claims and the actual audience metrics, one must examine the specific data sets provided by both traditional ratings agencies and digital platforms.
The Television Battlefield
Television remains the premier baseline for measuring mass media consumption in the United States. On both nights of the convention, the Republican programming went head-to-head with heavy-hitting NFL broadcasts.
- Night One (Sept. 10): NBC Sports reported that its season opener featuring a Super Bowl LX rematch between the Seattle Seahawks and the New England Patriots drew a massive 25.1 million viewers across NBC and Peacock. Concurrently, Trump’s address was broadcast live on a select group of cable news networks and digital channels. According to data compiled by CNN chief media analyst Brian Stelter, Fox News averaged 2.5 million viewers (consistent with its standard nightly baseline), Newsmax drew approximately 400,000, and NewsNation brought in roughly 125,000. Factoring in peak YouTube and streaming metrics, which largely hovered in the hundreds of thousands of views for the most popular uploads, the total television and direct streaming audience for the convention struggled to clear 3.3 million viewers—roughly one-seventh of the NFL opener’s audience.
- Night Two (Sept. 11): The NFL’s Melbourne, Australia game featuring the San Francisco 49ers and Los Angeles Rams brought in 18.5 million U.S. viewers via its broadcast and streaming distribution. By comparison, the convention’s second night averaged 2.6 million viewers on Fox News, 350,000 on Newsmax, and about 100,000 on NewsNation, keeping the political event’s broadcast footprint around the 3 million viewer mark.
[Night 1 Audience Comparison]
NFL Game (Seahawks vs. Patriots):  ■■■■■■■■■■■■■■■■■■■■■■■■■ (25.1 Million)
GOP Convention (Total Broadcast):   ■■■ (3.3 Million)

[Night 2 Audience Comparison]
NFL Game (49ers vs. Rams):          ■■■■■■■■■■■■■■■■■■ (18.5 Million)
GOP Convention (Total Broadcast):   ■■■ (3.0 Million)
The Digital Pivot: Decoding Social Media "Impressions"
Unable to substantiate the broadcast claims via Nielsen data, defenders of the administration leaned heavily on digital metrics. Citing an X post by Trump adviser Alex Bruesewitz and a report from the conservative outlet Breitbart, the White House highlighted that livestreams on the @TeamTrump TikTok account had generated "more than 70 million combined impressions across nights one and two," including a reported 34 million impressions on the first night alone.
However, data scientists and digital media experts warn that treating "impressions" as an equivalent metric to television viewership is fundamentally misleading.
- What is an Impression? On platforms like TikTok, X, and Meta, an impression simply means that a piece of content was rendered on a user’s screen. It requires zero engagement. A user does not need to click, like, comment, share, or even pause their scroll. If a video auto-plays for a fraction of a second while a user is swiping past cat videos or cooking tutorials, it registers as an impression. Furthermore, if the same user scrolls past the same video multiple times, it logs multiple impressions.
- The "Lottery Ticket" Analogy: Justin H. Gross, director of the data analytics and computational social science program at the University of Massachusetts-Amherst, describes impressions as "a lottery ticket for a chance at engagement." While advertisers utilize impressions to gauge the overall opportunity for consumer reach, they do not reflect actual human consumption or sustained attention.
- The Nielsen Standard: By contrast, traditional broadcasting metrics enforced by Nielsen require a minimum threshold of continuous viewing—typically at least one full minute—to log a viewer. Similarly, platforms like TikTok and Facebook track granular metrics such as "two-second" or "six-second" views, which demand significantly more intentional user behavior than a passive impression. "Of the estimated 25 million viewers of these NFL games, I imagine almost all watched at least some of the game," Gross noted. "Sure, they may leave to use the bathroom or grab some wings, but most have actively chosen to watch a game."
When evaluated against other major cultural and sporting events, the convention’s reported impression totals—while respectable for a political campaign—fall well short of true mass-market digital phenomena. For comparison, World Wrestling Entertainment (WWE) claimed 2.2 billion social media impressions for Wrestlemania 38 in 2022, and Super Bowl LVI generated roughly 1.8 billion impressions during the same year. Media scholars point out that generating 34 million impressions is a standard threshold for high-profile institutional accounts, routinely achieved by mainstream corporate and entertainment entities such as CNN, the NFL, or pop superstar Taylor Swift.
Official Statements and Institutional Responses
The fallout from the ratings debate underscored a broader institutional tension between political communication teams and objective media researchers.
When approached for empirical substantiation of the president’s Truth Social claims, White House spokespersons declined to provide traditional broadcast telemetry, opting instead to direct journalists toward the aforementioned social media data points circulating within conservative digital ecosystems. This reliance on digital proxies highlights a strategic shift within modern political campaigns: when traditional media gatekeepers and ratings agencies refute an administration’s narrative, campaigns increasingly bypass legacy metrics entirely, leaning into proprietary or platform-specific data that defies straightforward, apples-to-apples verification.
Meanwhile, media analysts such as Brian Stelter and academic researchers specializing in computational social science have used the episode to reiterate the importance of methodological literacy among the public. As Jen Golbeck, a professor at the University of Maryland’s College of Information, observed, conflating top-of-funnel digital ad metrics with verified broadcast viewership misrepresents the fundamental mechanics of how media is consumed in the digital age.
Historical Pattern of Crowd and Viewership Inflation
President Trump’s insistence on claiming record-breaking audience sizes and crowd numbers is not an isolated incident; rather, it represents a well-documented rhetorical strategy that has characterized his public life for decades.
- The 2017 Inauguration Crowd: On January 21, 2017, the day after Trump’s first swearing-in ceremony, then-Press Secretary Sean Spicer held a contentious press briefing in which he asserted, "This was the largest audience to witness an inauguration, period—both in person and around the globe." Photographic evidence, transit data, and aerial comparisons quickly debunked the claim, leading independent fact-checkers, including PolitiFact, to issue a rare "Pants on Fire" rating.
- Reality Television Ratings: Long before entering formal politics, Trump frequently sparred with media outlets over the performance of his reality television program, The Celebrity Apprentice. In 2011, amid speculation regarding his potential political ambitions, Trump claimed that his show was unequivocally the "No. 1 show on NBC." Independent reviews of network data revealed a more nuanced reality—while the show performed respectably, it held the top spot in specific demographic windows rather than as an outright universal ratings champion across all metrics, earning a "Half True" designation from media watchdogs at the time.
This consistent pattern suggests that claims of record-shattering public engagement serve a dual purpose within the political ecosystem: they project an image of unstoppable momentum to supporters while simultaneously establishing an aggressive counter-narrative designed to preempt and neutralize critical media reporting.
Future Outlook
As the United States barrels toward subsequent electoral cycles, the battleground over media metrics is destined to intensify. The Dallas convention episode illustrates a permanent evolution in political discourse: the fracturing of shared reality into competing statistical frameworks.
In the future, political campaigns will likely lean even further into decentralized, unverified digital indicators—such as impressions, algorithmic reach, and localized streaming hits—while traditional media organizations and ratings agencies continue to rely on standardized, time-tested methodologies like Nielsen tracking. Because these two systems measure entirely different phenomena (passive digital exposure versus active, sustained human attention), future clashes over public reach are guaranteed.
Ultimately, as long as political leaders find utility in projecting cultural dominance over mainstream entertainment and sports monoliths like the NFL, the public will be left to navigate a complex labyrinth of competing data points, requiring ever-greater media literacy to distinguish between genuine mass appeal and political hyperbole.